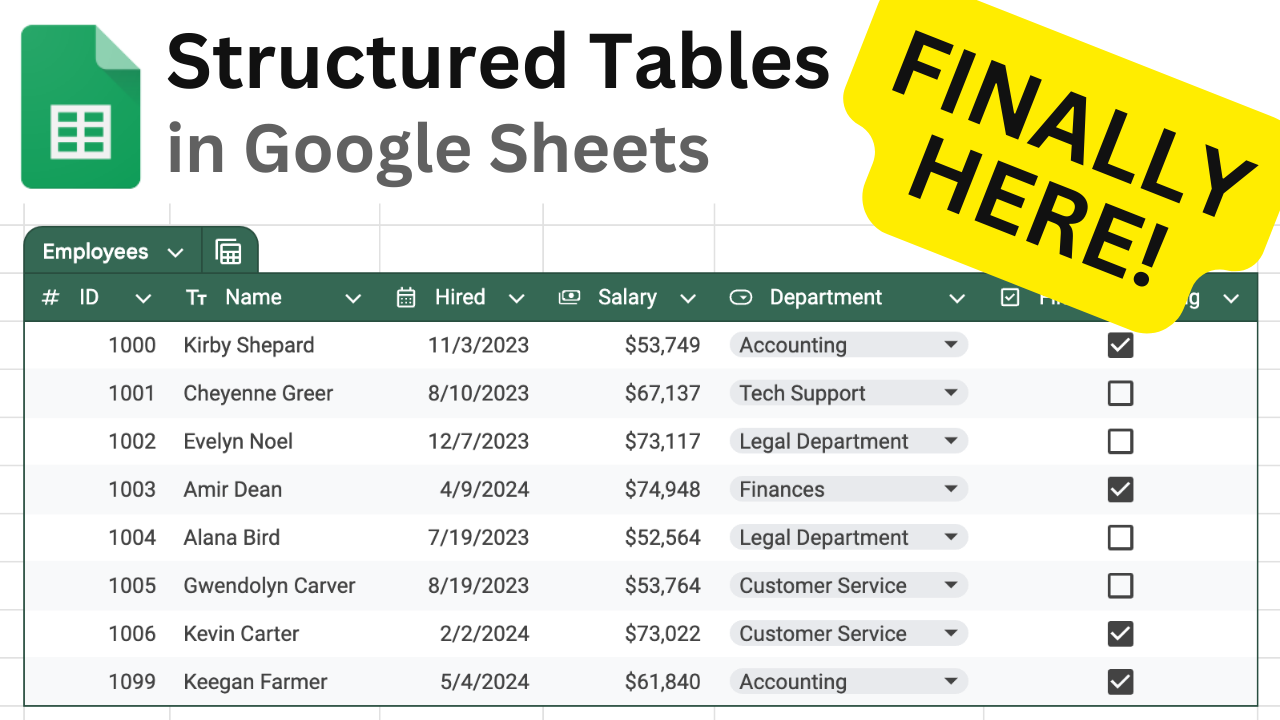
Structured Tables in Google Sheets
Updated in December 2024: footer/totals row and extended table references
Google recently introduced Tables in Google Sheets. This is the most significant update since 2022 when they added the Lambda family and named functions.
The name of this feature could be more helpful. Structured Tables would make more sense. In essence, it is a mix of data validation, formatting, named ranges, and filters with several quality-of-life improvements.
Watch the video version of this guide on YouTube:
In this guide, we will look at:
A. How to create tables
1. Create a table from scratch
2. Convert existing data into a table
3. Use presets
B. How to configure tables
1. Table name
2. Columns’ names
3. Columns’ data types
4. Data formatting
5. Table’s color
6. Totals/Footer Row
C. Tables’ features
1. Table references
2. Group rows by a column values
3. Enforce data validation and format
4. Placeholders
5. Tables grow with the data
6. Easy dropdowns
7. Easy access to sorting and filtering
D. Limitations of tables
1. Table references do not work everywhere
2. No custom data validation
3. Tables do not grow with dynamic data
4. You cannot merge cells in a table
5. Forced design
E. When (not) to use tables
A. How to Create Tables
There are three ways to add tables to your Google Sheets.
1. Create a Table From Scratch
To add a table to an empty sheet:
-
Select the range you want the table to cover. It is better to select the entire columns - we will see why later.
-
Open the Main Menu ->
Format->Convert to table.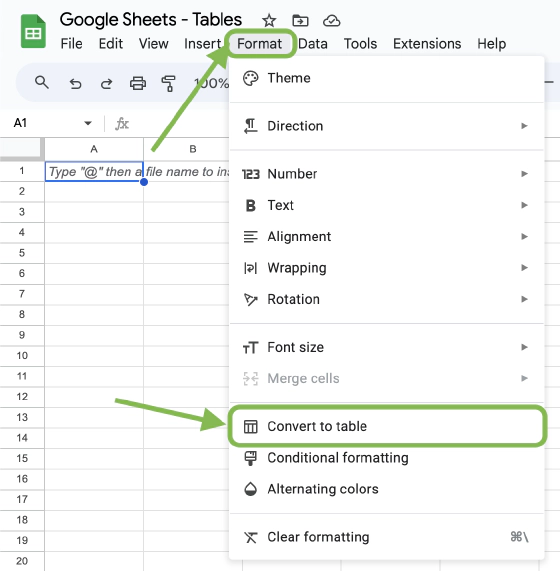
Convert range to a table
2. Convert Existing Data into a Table
To convert existing data to a table:
-
Select the data. As with the previous method, it is better to select the entire column if you can afford it.
-
Open the Main Menu ->
Format->Convert to table.
3. Use Presets
Finally, you can use one of the many presets that Google provided:
-
In the Main Menu, click
Insert->Tables: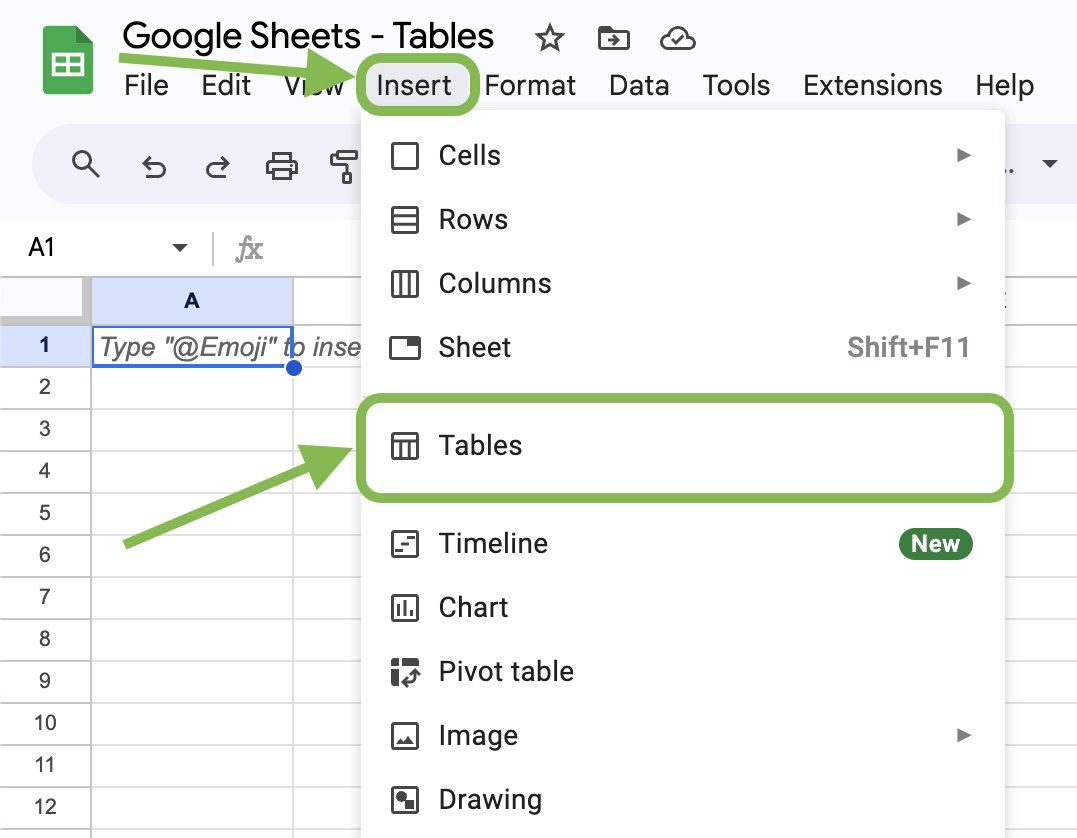
Insert a table preset -
Choose a template from the side panel:
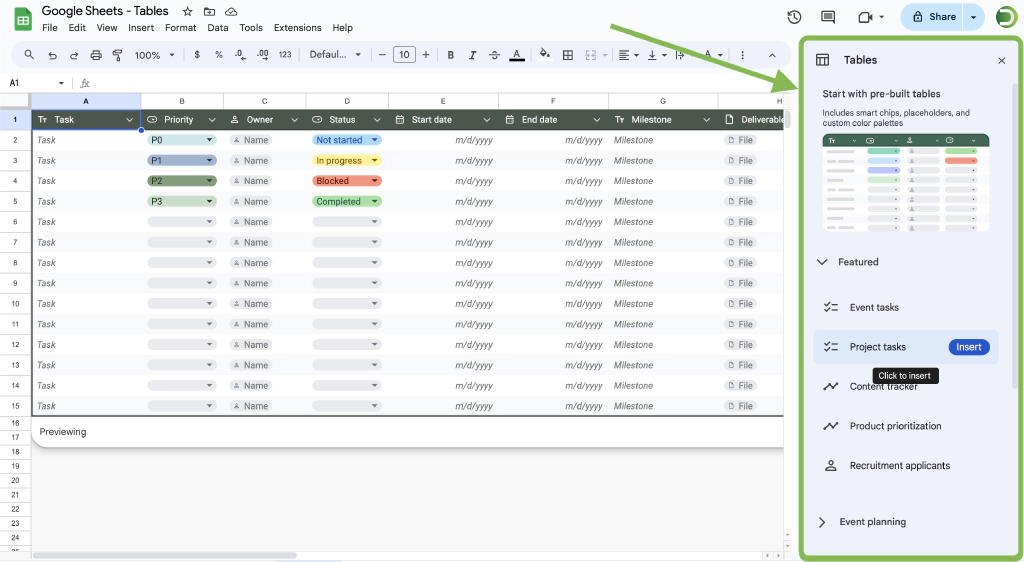
Choose a table preset If the sheet you are on is empty, it will be inserted in place; if not, it will be on a new sheet.
B. Configure Tables
These are the things you need to do to get the most out of the tables.
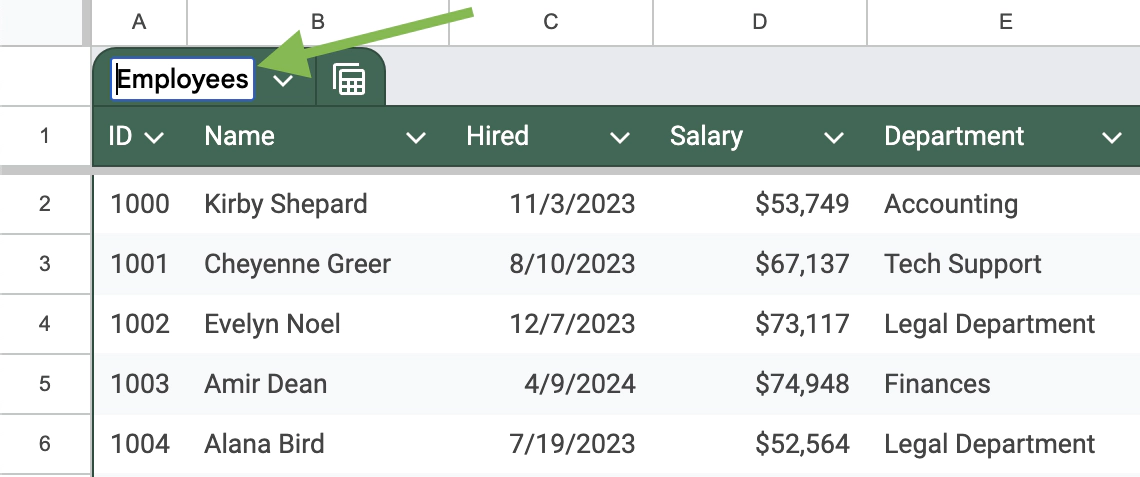
1. Table Name
Give the table a clear name. You will use it later to refer to the data. It also must be unique in the document and cannot be the same as any named range or function.
2. Columns’ Names
Name the columns. These names will also be used to reference the table data. A table shouldn’t have columns with duplicate names, or you will have issues accessing the data.
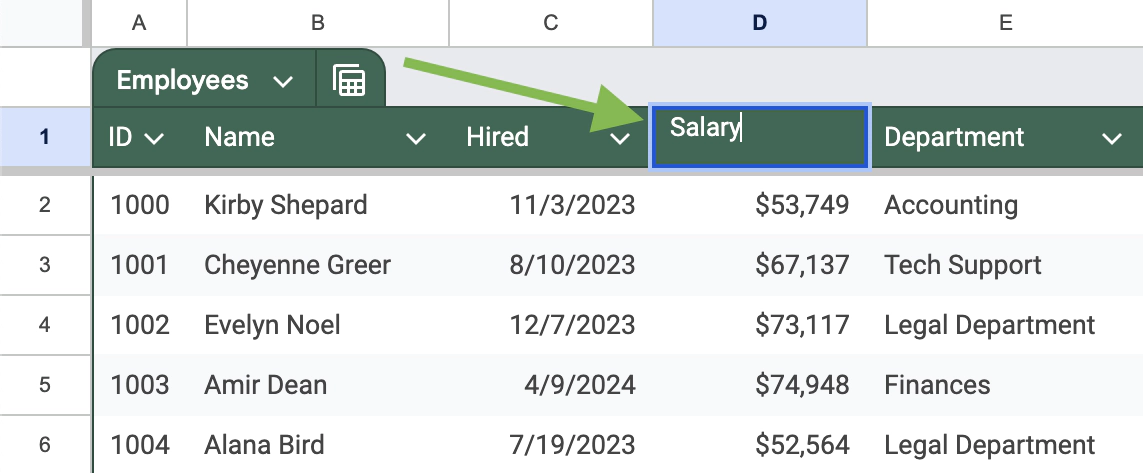
You can rename a column by double-clicking or typing over its content like any other cell.
3. Columns’ Data Types
Set the data type of the columns via the column menu:

For most data types, it is equivalent to setting data validation on the entire column and formatting it. The current type of the column is indicated in the header row by an icon:
4. Data Formatting
Adjust the formatting of the columns. You do not have to select the column: all the format changes you make in one cell will apply to the entire column.
5. Table’s Color
Adjust the table’s color and, optionally, turn off alternating colors.
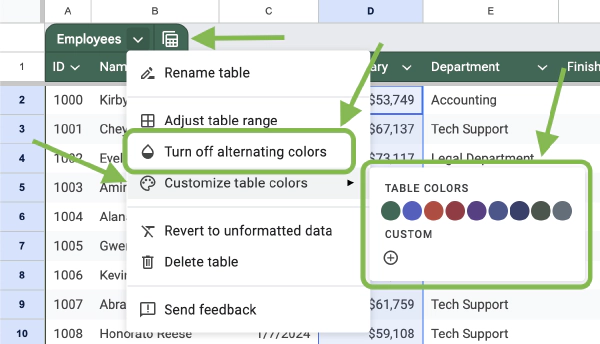
You can also fine-tune the alternating colors by selecting any cell on the table and opening the Main Menu -> Format -> Alternating Colors.

Here, you can update the alternating colors:

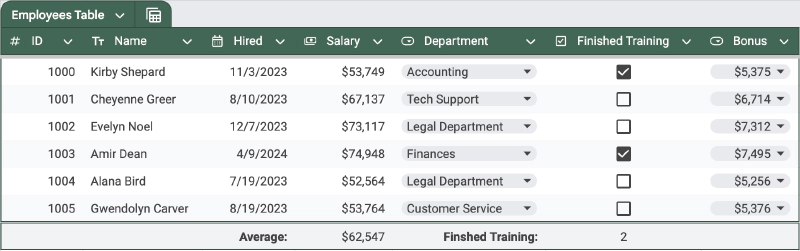
6. Totals/Footer Row
You can add a “totals” row to a table either:
- by adding any formula that has a table reference in it to an empty row immediately below the table:
Creating a footer row by adding a formula with a table reference - via Main Menu → Format → Alternating colors and enable the footer

Enable footer row in Alternating colors
The totals row differs from the regular data rows in two aspects:
- It has different formatting and colors.
- It is not subject to the data format checks which means that you can arrange data there as you wish.
You can remove the footer row by disabling it in the Alternating colors: it will become a regular data row.
C. Features
Now, let’s look at what tables can do. These are the seven most exciting features of tables so far:
1. Table References
The most significant change is how we can now address data in the tables. In many ways, this is equivalent to creating named ranges for the table as a whole and its columns separately.
In a formula, you now can start typing the name of your table and get access to different parts of the table’s data:
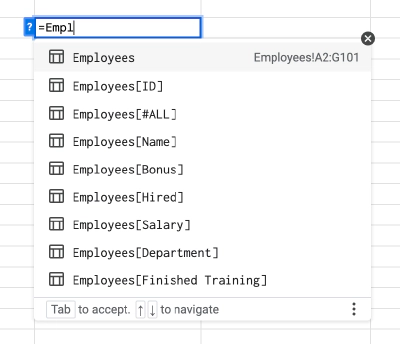
Although, autocomplete doesn’t work with complex ranges (next).
Let’s break down the different ranges:
-
Tablewill return the entire table without the header row. If the table name contains spaces, in the range they will be replaced with underscores. You can also useTable[#DATA]but it is auto-replaced withTable. -
Table[#ALL]- returns the entire table with a header and footer (if it exists) rows. It is helpful in theQUERYfunction. -
Table[#HEADERS] -
Table[#TOTALS] -
Table[Column Name]- all the data from a given column without the header. -
December 2024 update: You can construct the range to include several types of rows and multiple columns:
Types of rows, separated by commas[#ALL]: includes all three below[#HEADERS]: header row[#DATA]: all data rows[#TOTALS]: totals/footer row
One or a pair of columns in square brackets separated by a colon:
[Column Name 1]:[Column Name 2].
For example:Table[[#ALL],[Column Name]]: header, data, totals for one columnTable[[#ALL],[Column Name 1]:[Column Name 2]]: header, data, totals for a range of sequential columnsTable[[#HEADERS],[#DATA],[Column Name]]: only headers and data for one columnTable[[#DATA],[#TOTALS],[Column Name 1]:[Column Name 2]]: data and totals for a range of columns
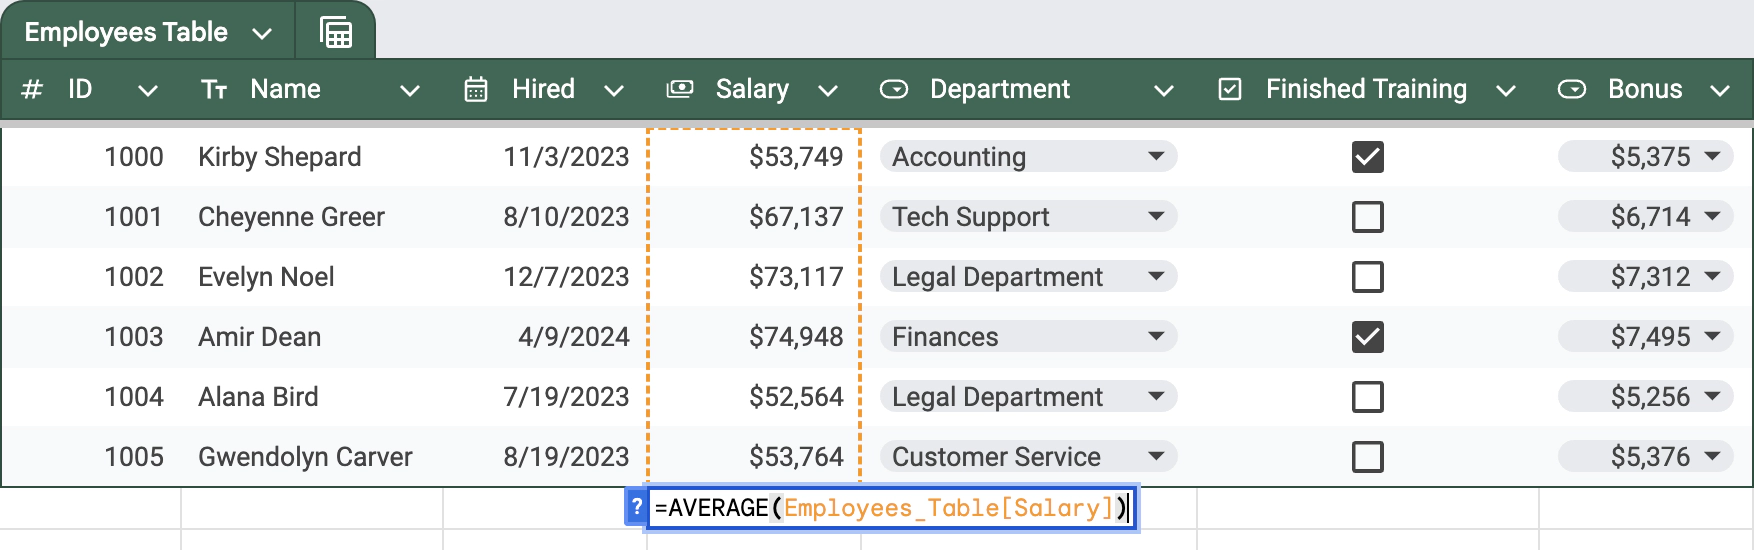
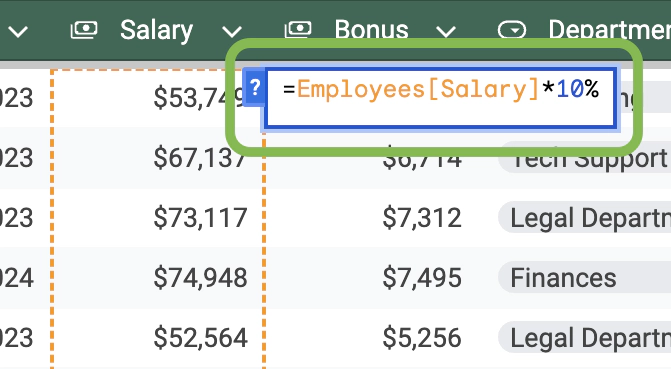
In addition, if you refer to a column outside certain functions, for example, SUM and AVERAGE, the sheets will return the value from the same row of that column, and you can use it in other calculations:
Important considerations:
-
If you rename a column or a table, all the references in the same document will get updated accordingly. Except those used in
IMPORTRANGEsince those are passed as text not a real range. -
Suppose you remove a table via the table’s menu ->
Revert to unformatted data. In that case, the table references will be converted to absolute references to the same cells where the data previously was.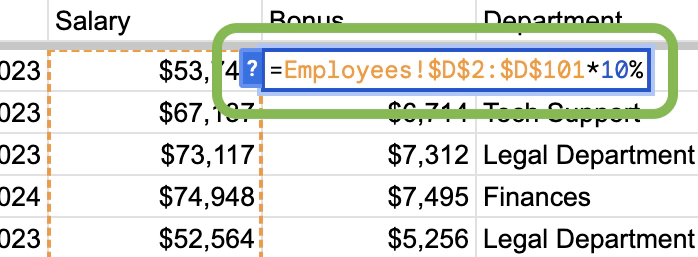
A table reference after the table is reverted to unformatted data -
If you have several columns with the same name, you will have access to only to the first one and the second one will be inaccessible. At the same time, the sheets will display a warning:
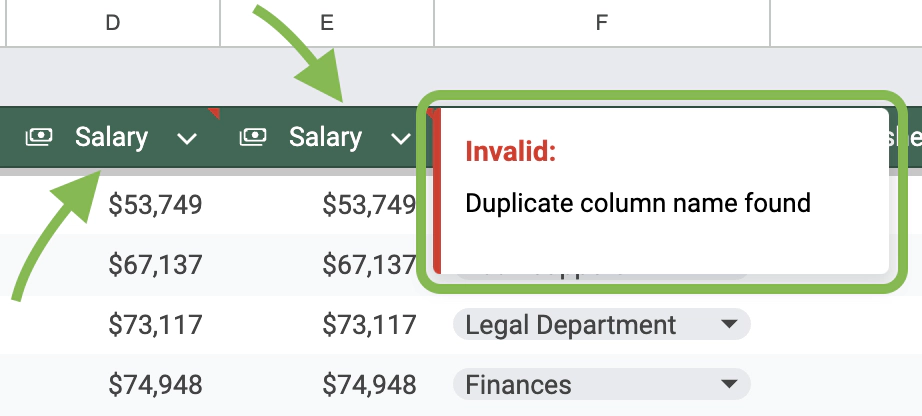
Warning for columns with duplicate names
2. Group Rows by a Column Values
You can group the data by values from a certain column now:
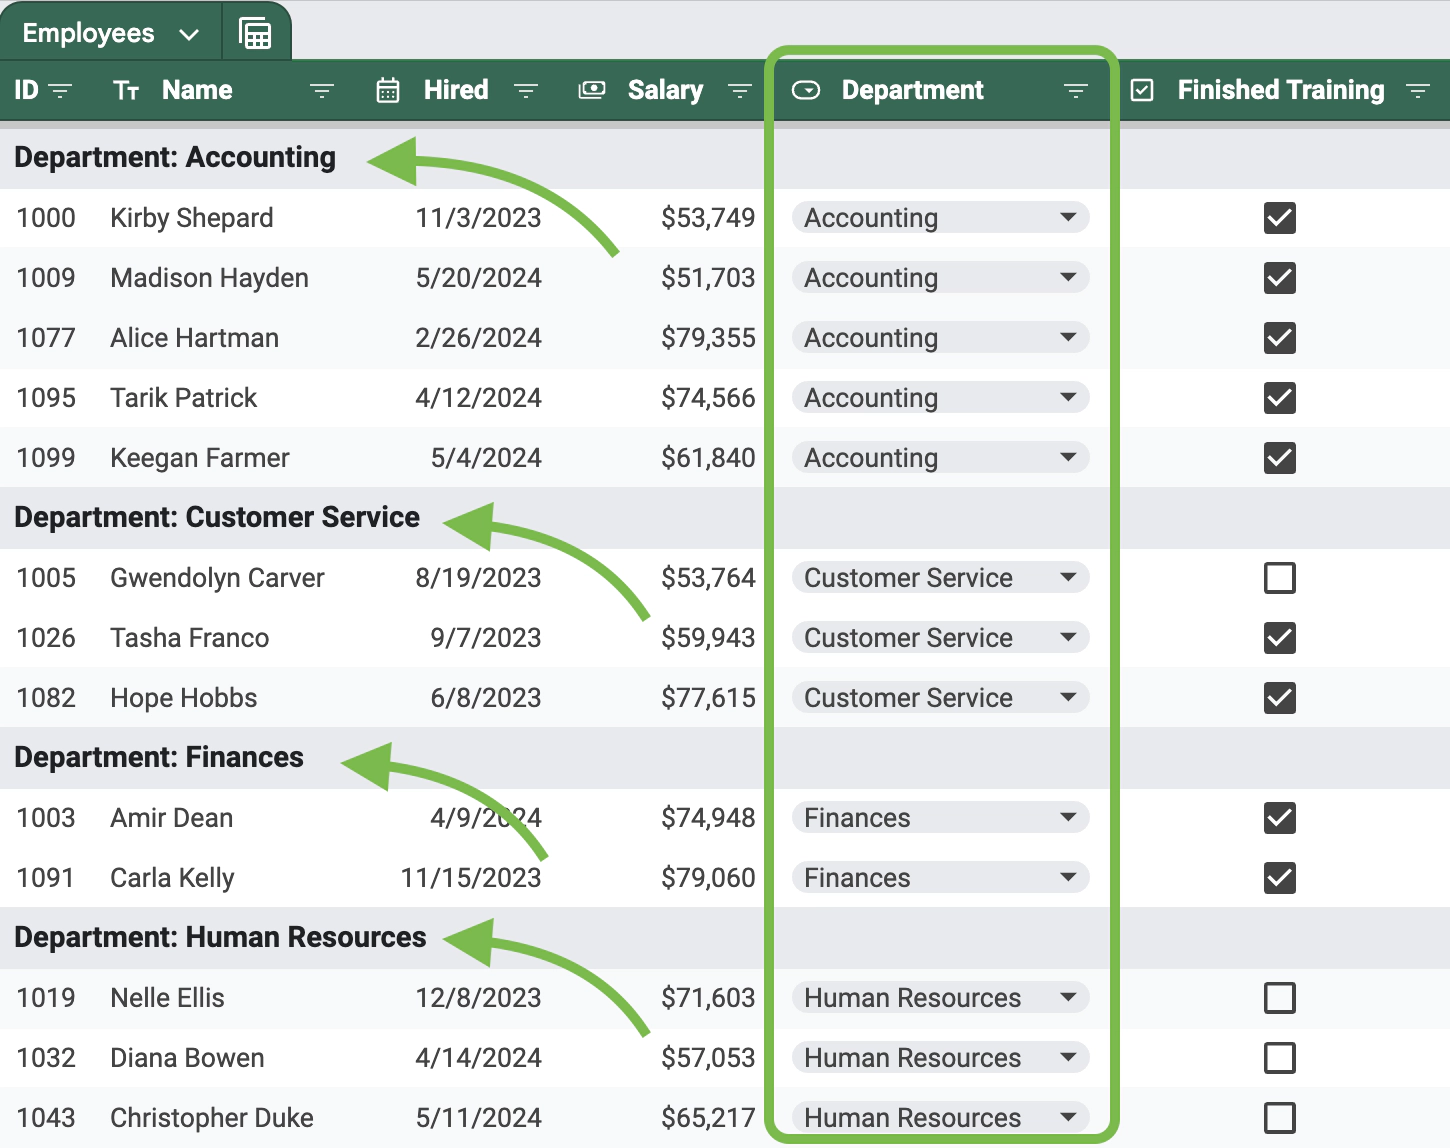
It will create a temporary view that you can save; see easy filtering below.
3. Enforce Data Validation and Format
The tables make it easy to enforce data type and format. You will no longer have inconsistent data quality. Setting the column’s data type is equivalent to setting data validation.
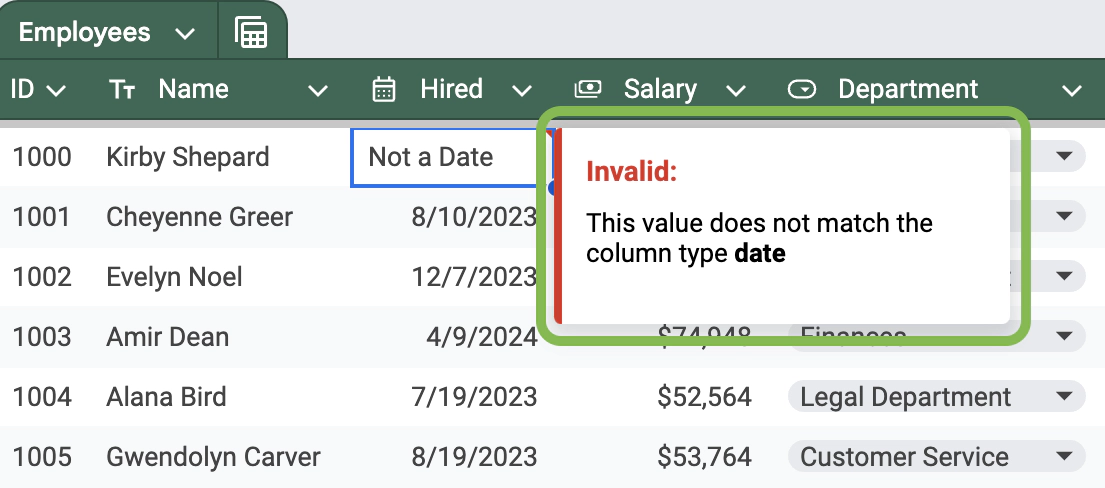
The table will highlight invalid data. Unfortunately, you cannot make the tables reject the data like with regular data validation — read more on that in the limitations section below.
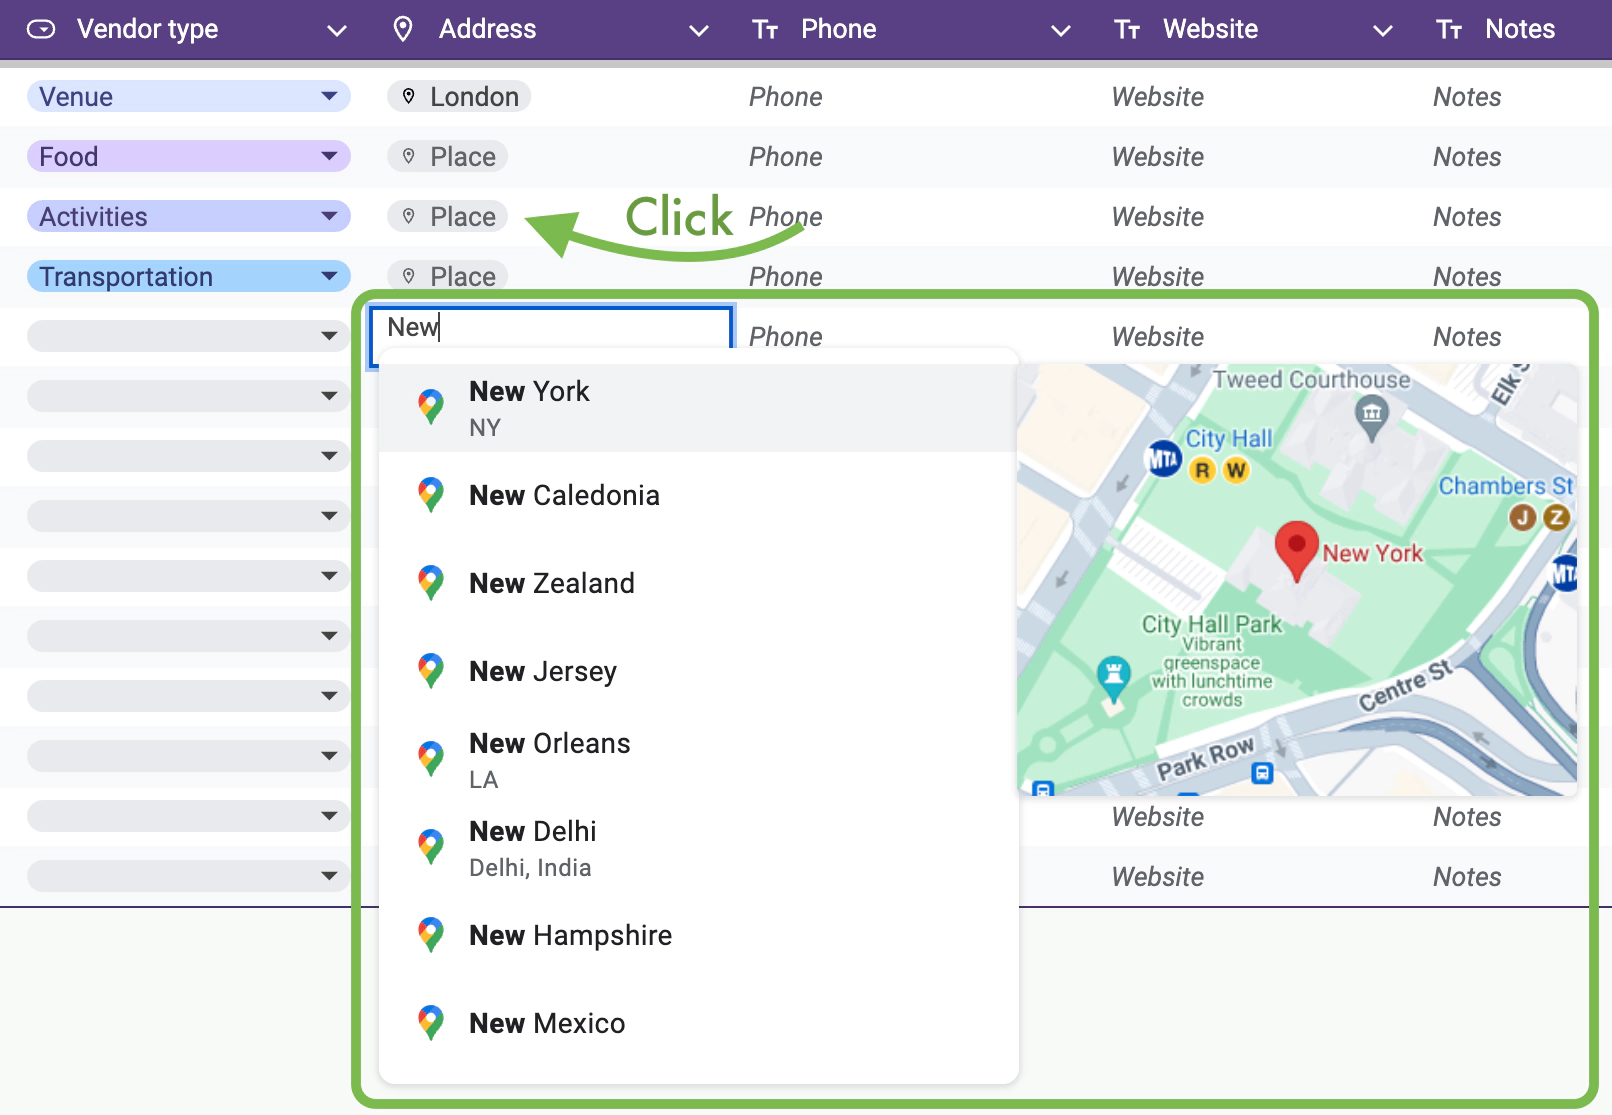
4. Placeholders
Each column can now have a placeholder indicating the expected data type.
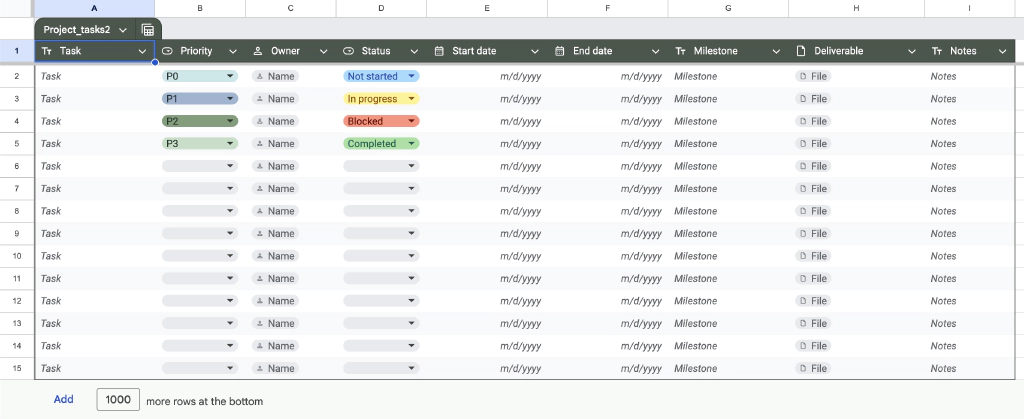
It is purely cosmetic for most data types but very useful for the smart chips column type, as you can just click on the placeholder to activate a smart chip.
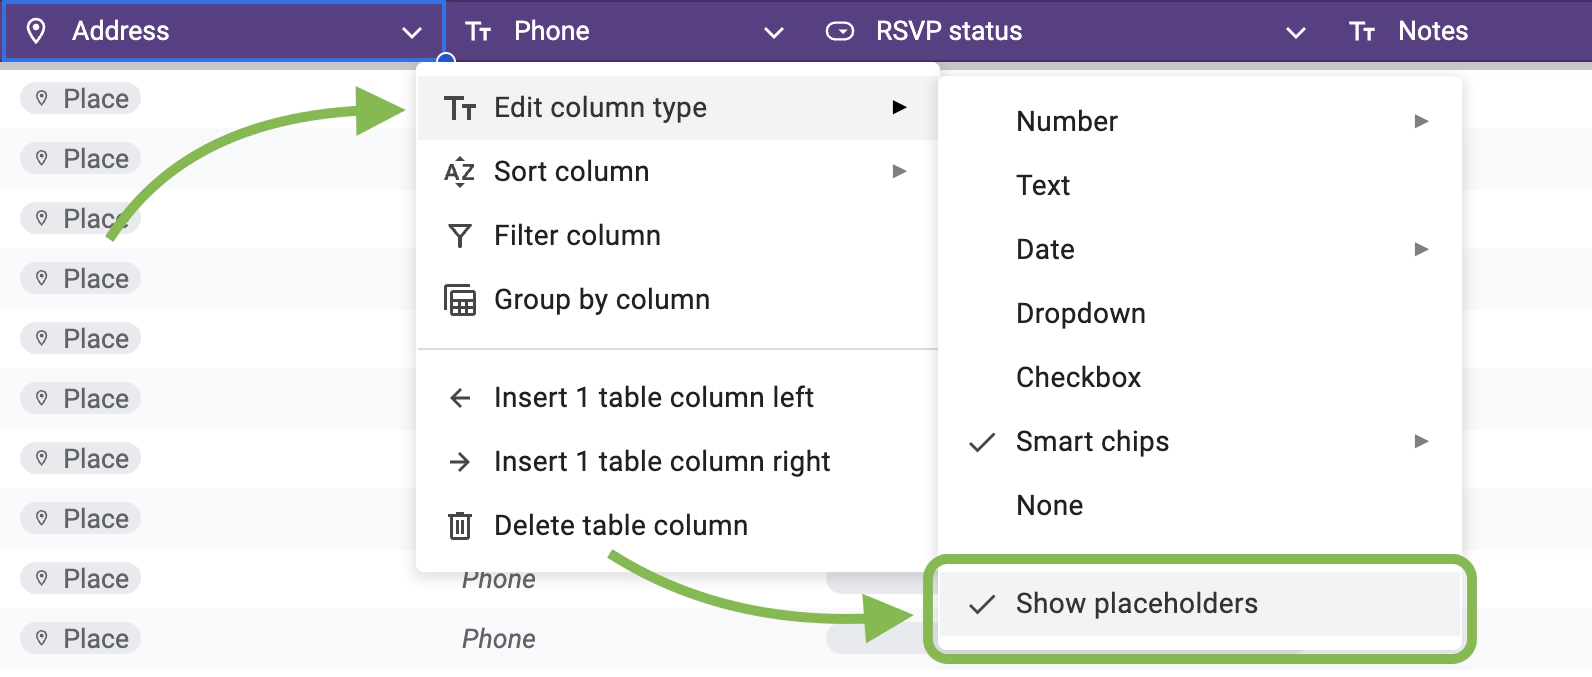
You can enable or disable placeholders from the column menu.
5. Tables Grow With the Data
Tables grow with the data (see limitations below). If you enter the data in a row immediately below the table, it will expand.
The same works with columns.
However, nothing will happen if you skip a row or the row under the table already contains some data. That is why applying a table to the entire column is generally better.
6. Easy Dropdowns
You can easily convert the data into dropdowns. Just select the Dropdown data type in the column menu.
Then, adjust the styling and list of options.
7. Easy Access to Sorting and Filtering
Tables give easier access to sorting and filtering from the column menu:

You can conveniently access available filter views from the table menu:

D. Limitations of Tables
So far, the tables look very good. But they are not perfect. Let’s look at their limitations.
1. Table References Do Not Work Everywhere
The table references we discussed in the previous section do not work everywhere. For example:
-
INDIRECTalso doesn’t support them as well. It means that we cannot use these references in conditional formatting rules.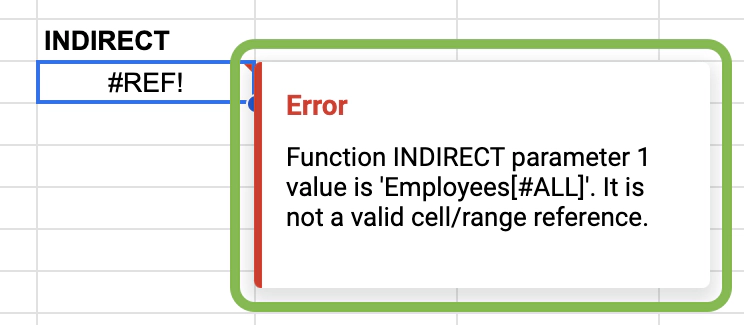
INDIRECTcannot find the table reference -
Charts also do not accept these ranges; they just delete them.
Interestingly enough, they work fine in the data validation dropdowns:
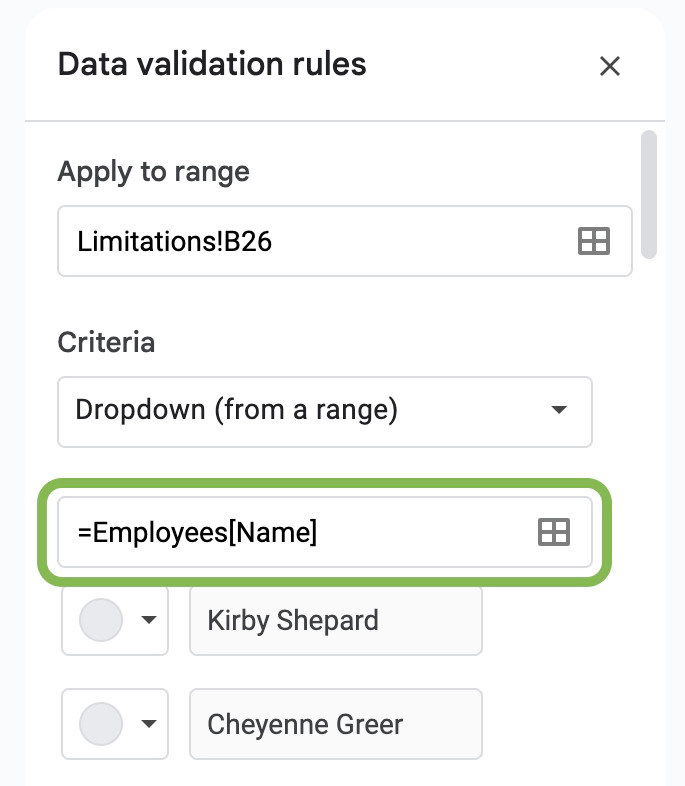
It might hint that these limitations will be removed at some point.
2. No Custom Data Validation
You cannot apply custom validation rules to the columns.
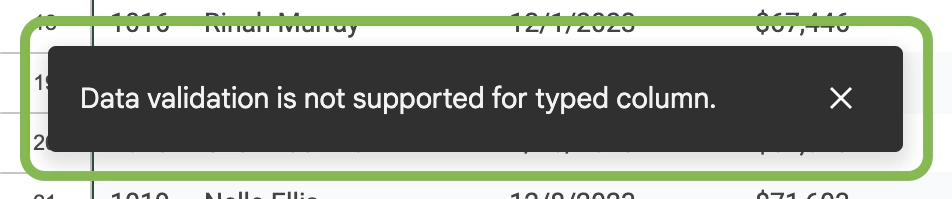
Even the dropdowns are limited: you cannot set a custom message or reject the input.
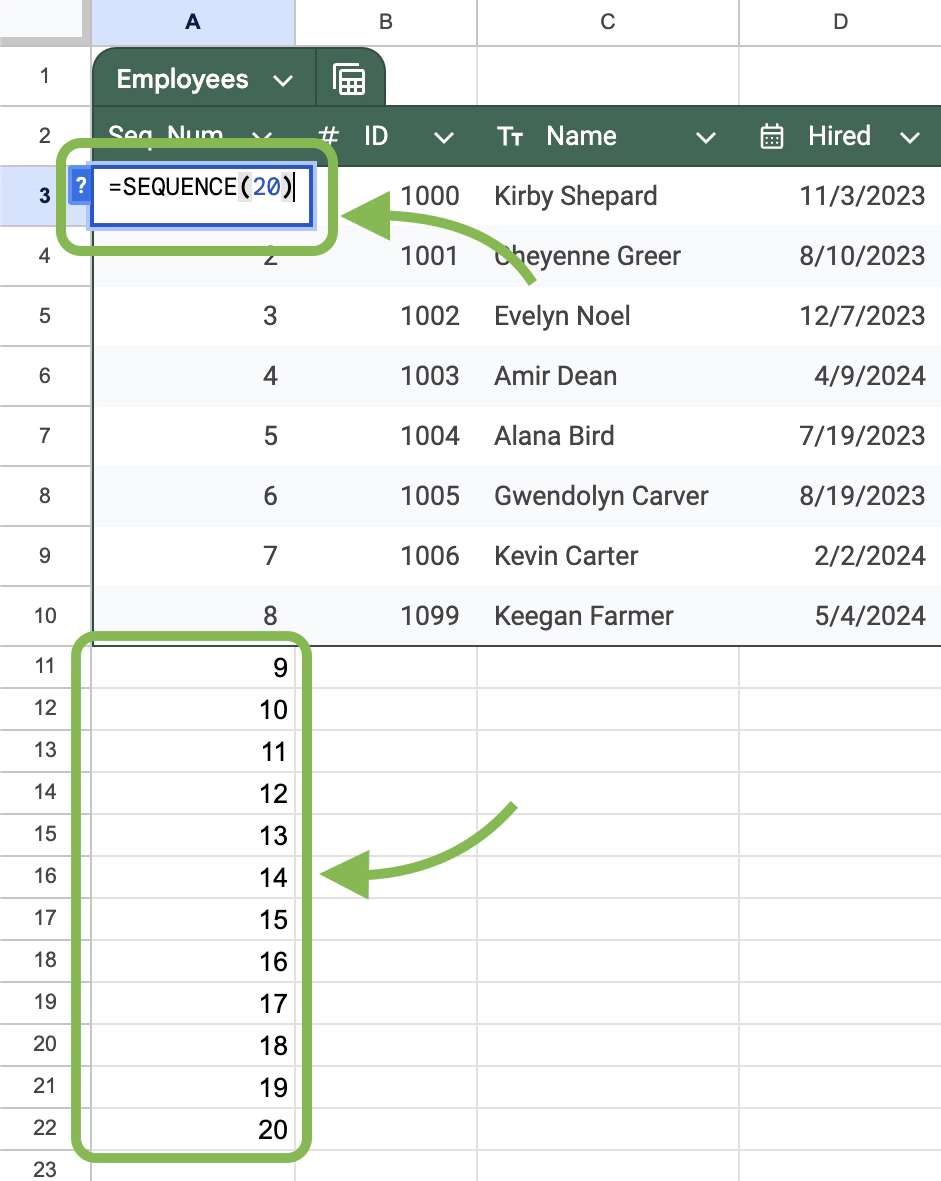
3. Tables Do Not Grow With Dynamic Data
While tables grow with the data you add manually, they ignore the output of formulas:
4. You Cannot Merge Cells in a Table
Tables do not allow merging cells:

It is understandable: merged cells and structured data do not go hand in hand.
5. Forced Design
Tables force you to use this new design, which removes the row and column separators, increases the row height, changes the font, and so on. You cannot adjust the formatting that much, as it will be ignored or overridden if the table expands.
I understand that Google is trying to make the sheets look sleek like applications, but I would prefer to have control over the formatting.
I hope Google will remove these limitations in the future.
E. Conclusion: When (Not) To Use Tables
I see two main use cases for the tables:
-
The tables will be a good fit if all you need is to streamline manual data input and reference it later. Most of the features they offer are not new but with tables it is faster and the result will be more consistent.
-
The tables are your only choice if you need some of their unique features: grouping, chip placeholders, etc. It is an interesting feature if you often need to review grouped data.
Conversely, the tables will not be the best choice if their limitations constrain you. For example:
- You need custom data validation in some columns.
- You need to use a complex data structure or table formatting.
- You heavily use the table contents in conditional formatting.
You still could use them but you would get out of the tables much less.